National Air Quality Dashboard
Real-time PM10 and PM2.5 readings from monitoring stations across India. Pick a state, city and station below to see hourly pollutant levels for any date, or scroll down for the national picture.
Every dot is a monitoring station. Colour marks severity — from green (Good) to purple (Very Poor). Tap a marker for the full pollutant breakdown at that spot.
Hourly pollutant levels for the location and date chosen above, so you can see how PM10, PM2.5 and other pollutants move through the day.
The ten most and least polluted states right now, ranked by average PM10 AQI across their stations.
| Top Polluted States | Top Clean States | ||
|---|---|---|---|
| State | Avg AQI (PM10) | State | Avg AQI (PM10) |
| Himachal Pradesh | 130.0 | Nagaland | 16.0 |
| Haryana | 72.1 | Uttarakhand | 18.0 |
| Kerala | 72.0 | Chhattisgarh | 20.7 |
| Rajasthan | 70.6 | Chandigarh | 25.0 |
| Jharkhand | 69.0 | West Bengal | 28.8 |
| Delhi | 65.2 | Maharashtra | 35.9 |
| Gujarat | 63.4 | Karnataka | 37.0 |
| Uttar Pradesh | 59.9 | Telangana | 38.0 |
| Punjab | 56.5 | Madhya Pradesh | 39.0 |
| Tamil Nadu | 52.5 | Odisha | 42.8 |
Seven-Day Trend
How air quality has moved over the last weekDaily average AQI for the selected state over the past seven days — a quick way to spot whether the air is getting better or worse through the week.
Colour bands used throughout this dashboard, based on standard PM10 and PM2.5 breakpoints.
| Colour | PM10 | PM2.5 | Category | |
|---|---|---|---|---|
| 00 - 50 | 00 - 30 | Good |  |
|
| 51 – 100 | 31 - 60 | Satisfactory |  |
|
| 101 – 200 | 61 - 90 | Moderate |  |
|
| 201 – 300 | 91 - 120 | Poor | 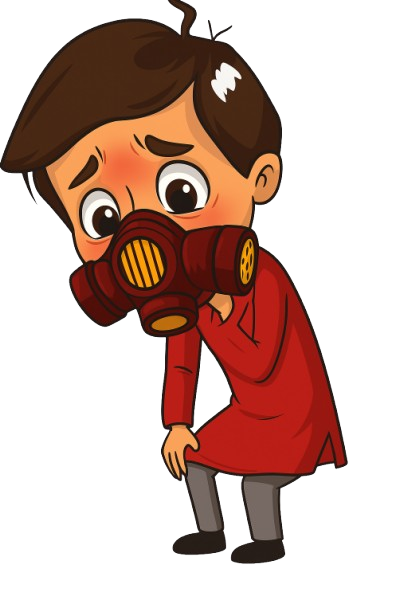 |
|
| 300+ | 121+ | Very Poor | 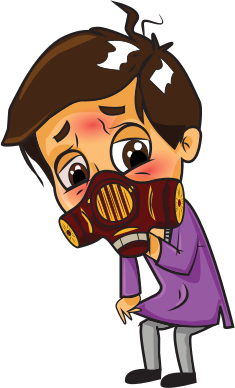 |
Monthly Comparison
Spot seasonal pollution patterns across the yearPM10 and PM2.5 monthly averages for the selected state across the current year. Useful for spotting seasonal spikes — such as winter smog or stubble-burning season — against calmer months.